This extension to ggplot2::facet_grid() will allow you to split
a facetted plot over multiple pages. You define a number of rows and columns
per page as well as the page number to plot, and the function will
automatically only plot the correct panels. Usually this will be put in a
loop to render all pages one by one.
Usage
facet_grid_paginate(
  facets,
  margins = FALSE,
  scales = "fixed",
  space = "fixed",
  shrink = TRUE,
  labeller = "label_value",
  as.table = TRUE,
  switch = NULL,
  drop = TRUE,
  ncol = NULL,
  nrow = NULL,
  page = 1,
  byrow = TRUE
)
Arguments
- facets
![[Deprecated]](figures/lifecycle-deprecated.svg) Please use
Please use rowsandcolsinstead.- margins
Either a logical value or a character vector. Margins are additional facets which contain all the data for each of the possible values of the faceting variables. If
FALSE, no additional facets are included (the default). IfTRUE, margins are included for all faceting variables. If specified as a character vector, it is the names of variables for which margins are to be created.- scales
Are scales shared across all facets (the default,
"fixed"), or do they vary across rows ("free_x"), columns ("free_y"), or both rows and columns ("free")?- space
If
"fixed", the default, all panels have the same size. If"free_y"their height will be proportional to the length of the y scale; if"free_x"their width will be proportional to the length of the x scale; or if"free"both height and width will vary. This setting has no effect unless the appropriate scales also vary.- shrink
If
TRUE, will shrink scales to fit output of statistics, not raw data. IfFALSE, will be range of raw data before statistical summary.- labeller
A function that takes one data frame of labels and returns a list or data frame of character vectors. Each input column corresponds to one factor. Thus there will be more than one with
vars(cyl, am). Each output column gets displayed as one separate line in the strip label. This function should inherit from the "labeller" S3 class for compatibility withlabeller(). You can use different labeling functions for different kind of labels, for example uselabel_parsed()for formatting facet labels.label_value()is used by default, check it for more details and pointers to other options.- as.table
If
TRUE, the default, the facets are laid out like a table with highest values at the bottom-right. IfFALSE, the facets are laid out like a plot with the highest value at the top-right.- switch
By default, the labels are displayed on the top and right of the plot. If
"x", the top labels will be displayed to the bottom. If"y", the right-hand side labels will be displayed to the left. Can also be set to"both".- drop
If
TRUE, the default, all factor levels not used in the data will automatically be dropped. IfFALSE, all factor levels will be shown, regardless of whether or not they appear in the data.- ncol
Number of columns per page
- nrow
Number of rows per page
- page
The page to draw
- byrow
Should the pages be created row-wise or column wise
Note
If either ncol or nrow is NULL this function will
fall back to the standard facet_grid functionality.
See also
n_pages() to compute the total number of pages in a paginated
faceted plot
Other ggforce facets:
facet_stereo(),
facet_wrap_paginate(),
facet_zoom()
Examples
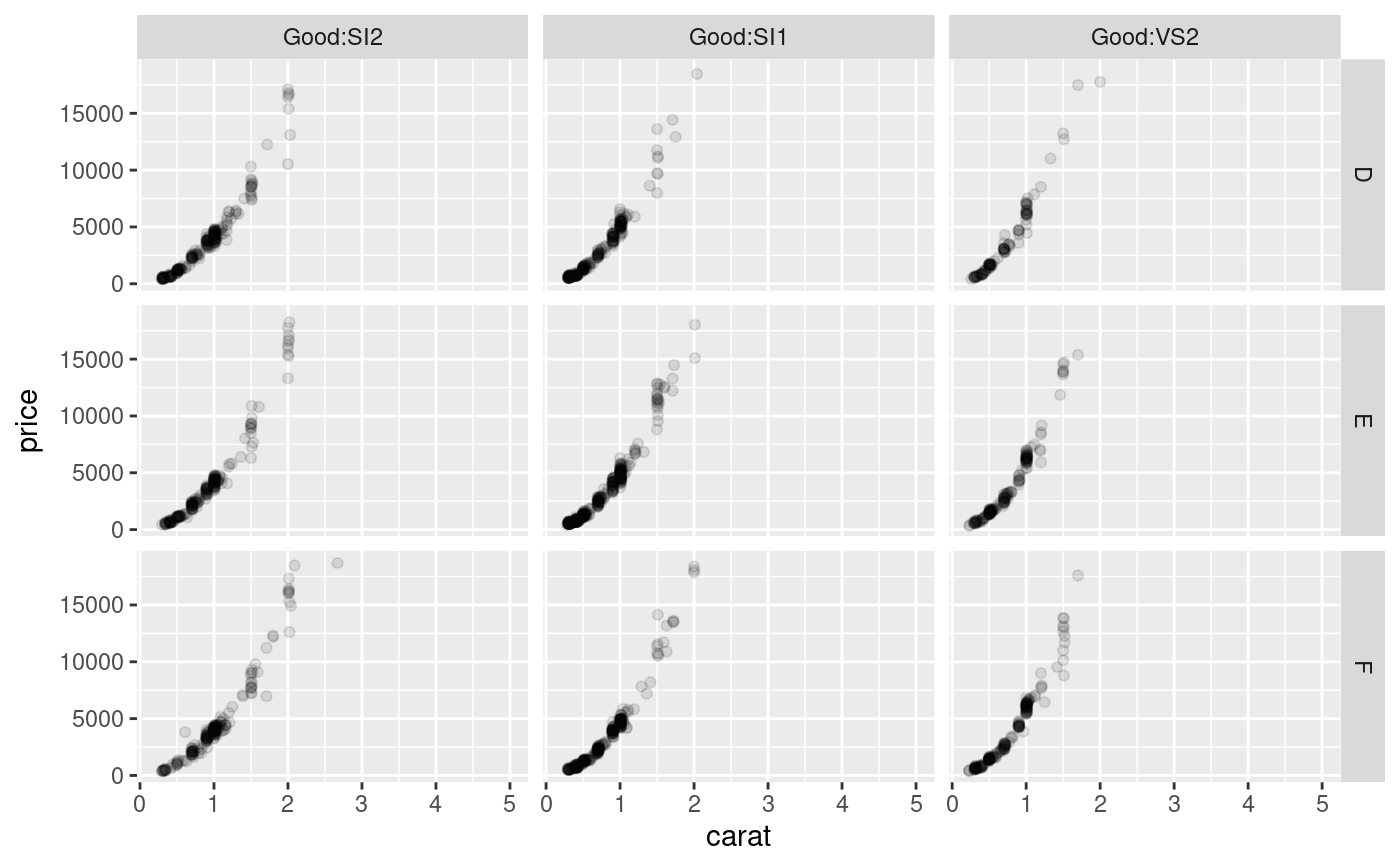
# Draw a small section of the grid
ggplot(diamonds) +
  geom_point(aes(carat, price), alpha = 0.1) +
  facet_grid_paginate(color ~ cut:clarity, ncol = 3, nrow = 3, page = 4)