This function creates a trans object that converts radial data to their corresponding coordinates in cartesian space. The trans object is created for a specific radius and angle range that will be mapped to the unit circle so data doesn't have to be normalized to 0-1 and 0-2*pi in advance. While there exists a clear mapping from radial to cartesian, the inverse is not true as radial representation is periodic. It is impossible to know how many revolutions around the unit circle a point has taken from reading its coordinates. The inverse function will always assume that coordinates are in their first revolution i.e. map them back within the range of a.range.
Arguments
- r.range
The range in radius that correspond to 0 - 1 in the unit circle.
- a.range
The range in angles that correspond to 2*pi - 0. As radians are normally measured counterclockwise while radial displays are read clockwise it's an inverse mapping
- offset
The offset in angles to apply. Determines that start position on the circle. pi/2 (the default) corresponds to 12 o'clock.
- pad
Adds to the end points of the angle range in order to separate the start and end point. Defaults to 0.5
- clip
Should input data be clipped to r.range and a.range or be allowed to extend beyond. Defaults to FALSE (no clipping)
Value
A trans object. The transform method for the object takes an r (radius) and a (angle) argument and returns a data.frame with x and y columns with rows for each element in r/a. The inverse method takes an x and y argument and returns a data.frame with r and a columns and rows for each element in x/y.
Note
While trans objects are often used to modify scales in ggplot2, radial transformation is different as it is a coordinate transformation and takes two arguments. Consider it a trans version of coord_polar and use it to transform your data prior to plotting.
Examples
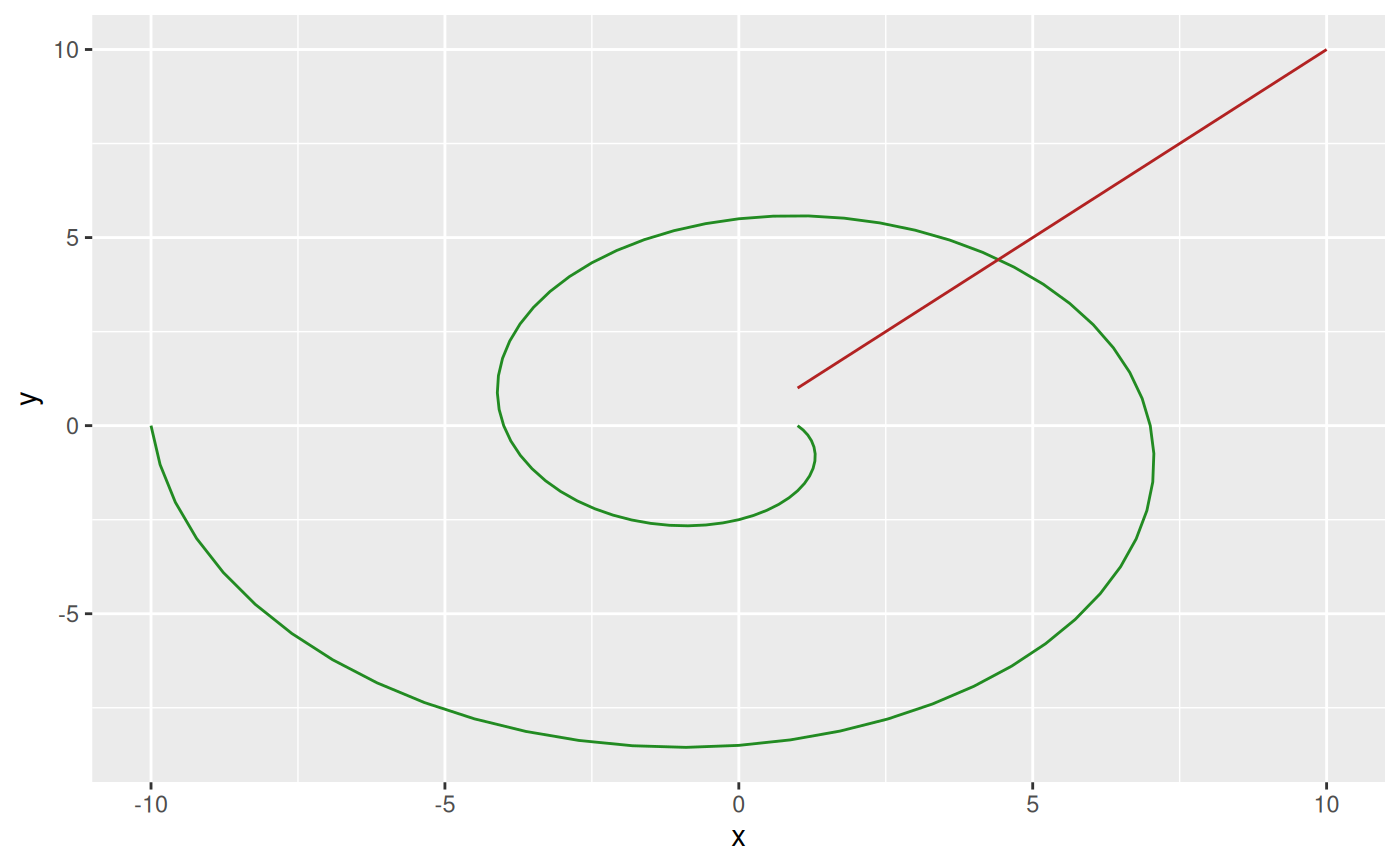
# Some data in radial form
rad <- data.frame(r = seq(1, 10, by = 0.1), a = seq(1, 10, by = 0.1))

# Create a transformation
radial <- radial_trans(c(0, 1), c(0, 5))

# Get data in x, y
cart <- radial$transform(rad$r, rad$a)

# Have a look
ggplot() +
  geom_path(aes(x = x, y = y), data = cart, color = 'forestgreen') +
  geom_path(aes(x = r, y = a), data = rad, color = 'firebrick')